


Wonderful introduction:
The moon has phases, people have joys and sorrows, whether life has changes, the year has four seasons, after the long night, you can see dawn, suffer pain, you can have happiness, endure the cold winter, you don’t need to lie down, and after all the cold plums, you can look forward to the New Year.
Hello everyone, today Avatrade Aihua Foreign Exchange will bring you "[Avatradescn Forex Market Review]: Spot gold hits a new high! US PCE has become the focus, and UK GDP has attracted much attention in Europe." Hope it will be helpful to you! The original content is as follows:
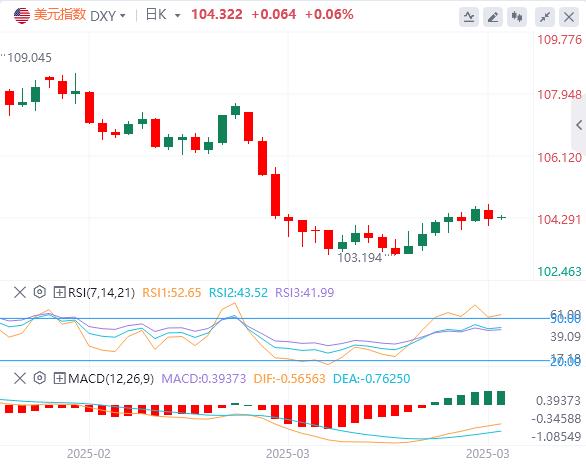
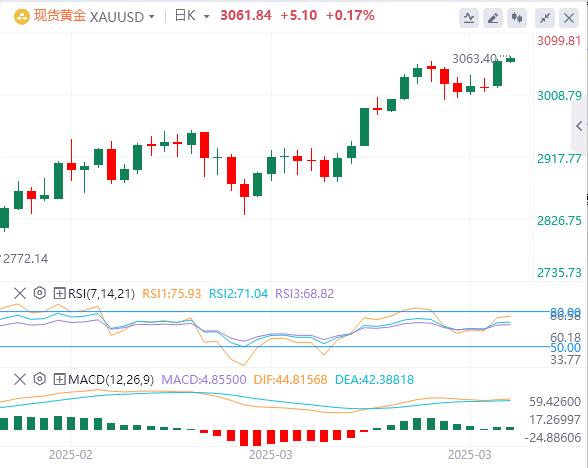
On March 28, in the early trading of the May 4th Asian market in Beijing time, the US dollar index hovered around 104.32. avatradescn.comOn Thursday, the US dollar index maintained a downward trend throughout the day, eventually closing down 0.37% to 104.28 as Trump's tariff policy brought uncertainty prospects to the US economy. The benchmark 10-year U.S. Treasury yield closed at 4.3660%; the two-year U.S. Treasury yield closed at 4.0020%, which is more sensitive to monetary policy. Although U.S. economic growth in the fourth quarter of last year was faster than previously expected, investors are more worried about Trump's announcement of new car tariffs. Spot gold hit a new high, refreshing its all-time high to $3057.85/ounce, and finally closing up 1.23% to $3056.76/ounce. Spot silver finally closed up 2.31% at $34.40 per ounce. As investors are still evaluating the tightening of crude oil supply and the new US tariffs and their expected impact on the world economy, international oil prices fluctuated narrowly, and WTI crude oil eventually closed slightly down 0.05% at $69.84 per barrel; Brent crude oil closed down 0.96% at $73.30 per barrel.
Analysis of major currencies
Dollar Index: As of press time, the US dollar index hovers around 104.32. The key U.S. data release this week will be the core personal consumption expenditure (PCE) price index inflation on Friday. Technically, if the US dollar index falls below 50MA of 103.94square, it will move towards the nearest support level 103.20–103.40.
Analysis of gold and crude oil market trends
1) Analysis of gold market trends
On Friday, gold trading around 3061.83. US President Trump suddenly announced an increase of 25% tariffs on imported cars, like dropping an economic bomb on the global market. Allies such as Canada, the EU, and Japan quickly showed a counterattack posture, overseas stock markets fluctuated violently, multinational automakers were in panic, a global trade confrontation officially kicked off, gold once again gained favor from safe-haven funds, spot gold hit a high of US$3,059.35 per ounce on Thursday (March 28), setting a new record high again. Investors are currently waiting for data on U.S. personal consumption spending released on Friday to determine the trajectory of further rate cuts after the Federal Reserve decided to keep the indicator rate unchanged last week.
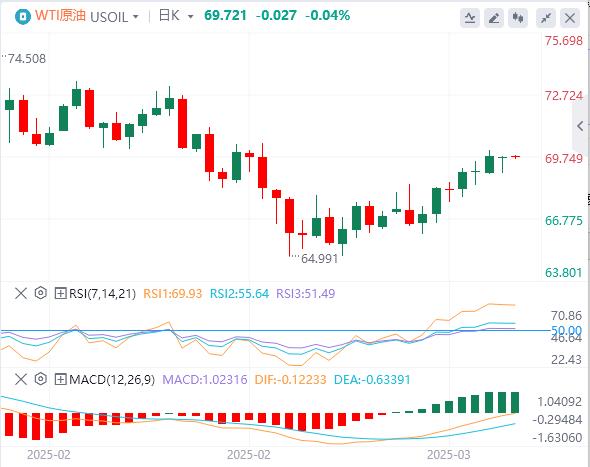
2) Analysis of crude oil market trends
On Friday, crude oil trading was around 69.72. Although short-term resistance levels put pressure on crude oil prices, the ongoing supply threat from U.S. sanctions and disruptions in Venezuela's oil supply indicate that oil prices still have upward potential. However, demand concerns and supply signals from the Organization of Petroleum Exporting Countries and its allies (OPEC+) limit market confidence. Be cautious in the short term, and it is necessary to see technological breakthroughs and guidance from macro signals. Investors are currently waiting for data on U.S. personal consumption spending released on Friday to determine the trajectory of further rate cuts after the Federal Reserve decided to keep the indicator rate unchanged last week.
Forex market trading reminder on March 28, 2025
15:00German April Gfk Consumer Confidence Index
15:00English fourth quarter GDP annual rate final value
15:00English January seasonally adjusted avatradescn.commodity trade account
15:00English February seasonally adjusted retail sales monthly rate
15:00English fourth quarter current account
15:45English March CPI monthly rate initial value
16:00Swiss March KOF leading economic indicator
>
16:55 The number of unemployed people in Germany after seasonal adjustment in March
16:55 The unemployment rate in Germany after seasonal adjustment in March
18:00 Eurozone March industrial prosperity index
18:00 Eurozone March economic prosperity index
20:30 Canada January GDP monthly rate
20:30 US February core PCE price index annual rate
20:30 US February personal expenditure monthly rate
20:30 US February core PCE price index monthly rate
22:00 US February The final value of the University of Michigan Consumer Confidence Index in March
22:00 The expected final value of the US one-year inflation rate in March
The next day, Fed Director Barr delivered a speech
The next day, 01:00, the total number of oil drilling rigs in the week from the United States to March 28
The above content is about "[Ava Aihua Foreign Exchange Market Review]: Spot gold hits a new high! US PCE has become the focus, and the UK GDP has attracted much attention in Europe" is carefully avatradescn.compiled and edited by the Avatrade Foreign Exchange editor. I hope it will be helpful to your trading! Thanks for the support!
Life in the present, don’t waste your current life in missing the past or looking forward to the future.